




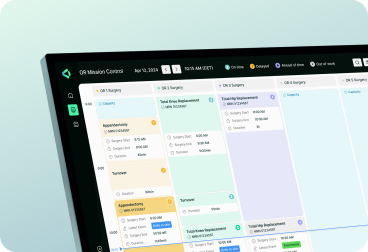



A Next.js app can score in the 90s on Lighthouse while support tickets keep saying it feels slow. Both sides are telling the truth about different moments. The test measures one clean page load, and users live in everything after it, from the first click to the tenth request.


In a Next.js and Supabase app, that “after” is where the waste builds up. The page appears, and the browser is still busy hydrating it when the user tries to scroll. Data requests line up one behind another, the same query reaches the database again and again, and a component receives far more data than it shows. Each of the problems usually passes code review without a single error, which is why they tend to reach production unnoticed.
This guide covers eight causes of a slow Next.js app, how to spot each one and the code that fixes it, along with a real dashboard where the fixes cut LCP by more than half.
{{banner}}
Users judge speed by feel, and Google evaluates that experience in part through three Core Web Vitals metrics. Their field data comes from real Chrome users:
Google says good scores align with what its core ranking systems seek to reward. A slow app can therefore lose twice: through visitors who give up and, in some cases, through weaker search performance.
More than half of mobile websites still miss at least one Core Web Vitals target. According to the HTTP Archive’s 2025 Web Almanac, only 48% pass all three. In lab testing, the median mobile page also recorded 1,916 ms of Total Blocking Time, 58% more than in 2024.
Inner pages perform worse on INP than home pages: 69% of secondary mobile pages meet the target, compared with 80% of home pages. For app-like products, those secondary pages often include dashboards, account screens, and search results — exactly the kinds of views where interaction performance matters most.
When a Next.js app slows down, the first suspects are usually a heavy hero image or a sluggish API endpoint. In many cases, the cost comes from the app’s own habits, and nearly every fix in a Next.js and Supabase app follows one rule with three parts:
In real projects, these problems tend to show up across a few recurring layers: the browser, the network, the server, and the database. The eight causes below span those layers, making it easier to connect a symptom with the work behind it.
Before changing any code, it helps to narrow the search. The Core Web Vitals report in Search Console shows which metric is failing and which pages are affected, giving you a clearer place to start.
On a mid-range phone, a dashboard’s filters can appear before they are ready to respond. React may still be hydrating the page, so taps wait until that work finishes.
A "use client" directive at the top of a page moves that component and its imported subtree into the client bundle, including parts that may not need interactivity.
"use client";

export default function Page() {
	return <Dashboard/>;
}
Without the directive, the page remains a Server Component, so data fetching and most rendering can happen on the server before the result is sent to the browser:
export default async function Page() {
  const data = await getData();
  return <Dashboard data={data} />;
}
How much this helps depends on the Dashboard. If Dashboard is itself a Client Component, its imported subtree still becomes part of the client bundle and needs client-side hydration where applicable. The directive belongs on the small interactive pieces, such as a date filter or a chart tooltip, while tables and headings stay server-rendered.
Hydration cost grows with bundle size and component complexity, and on a data-heavy dashboard it can contribute to noticeable main-thread blocking. In the Performance panel of Chrome DevTools, the problem shows up as a run of long tasks just after the first paint, coming from client-side JavaScript.
A waterfall happens when one request has to wait for another to finish, and on a profile page it can look like this:
const user = await getUser();
const posts = await getPosts(user.id);
The second call can’t start until the first returns, so the page pays for both round trips back-to-back. When the calls don’t depend on each other’s results, Promise.all starts them together, so the total time is roughly determined by the slower request rather than the sum of both:
const userId = session.user.id;
const [user, posts] = await Promise.all([
  getUser(userId),
  getPosts(userId)
]);
Waterfalls don’t break anything. They throw no errors, pass code review, and can quietly add noticeable latency to a page. In the Network panel of Chrome DevTools, a waterfall looks like a staircase, with each request starting where the previous one ended.
Here’s the usual version, with no persistent caching:
await fetch("https://api.example.com/data");
In current versions of Next.js, fetch requests are not persistently cached by default, so repeated requests can still reach the data source unless caching is configured. Adding revalidate gives that request a cache lifetime of up to 60 seconds, allowing later requests to reuse the cached response before it is revalidated:
await fetch("https://api.example.com/data", {
  next: { revalidate: 60 }
});
The setting lives on the individual request, so one page can combine a cached price list with live stock levels. Two details trip teams up on the server. A relative URL such as /api/data resolves in the browser, while server-side fetch generally needs an absolute URL. If that URL points to the app’s own route handler, the request also takes an extra network hop that a direct query to the data source would skip.
Without caching, repeated visits can trigger the same database work again, increasing backend load and potentially increasing TTFB as traffic grows. A query that doesn’t run costs nothing. Supabase’s Query Performance report shows which queries run most often, helping identify repeated work that may be worth investigating for caching. These considerations also matter when building fast backends in Supabase.
<!-- fs-richtext-ignore -->Image optimization usually means smaller files, and much less attention goes to the moment the main image starts downloading. A plain <img> tag may be discovered later than other critical resources, delaying the start of its download:
<img src="/hero.png"/>
LCP measures when the largest visible content element in the viewport finishes rendering, and on many pages that element is an image, so the browser needs to learn early that this file matters. Older Next.js guides use the priority prop for this, which Next.js 16 deprecated in favor of preload. The current docs also note that, in most cases, loading="eager" or fetchPriority="high" is the better fit:
<Image
  src="/hero.png"
  alt="Sales dashboard overview"
  width={1200}
  height={600}
  loading="eager"
  fetchPriority="high"
/>
loading="eager" tells the browser to load the image immediately, while fetchPriority="high" signals that it should receive higher download priority. These settings should be reserved for images that are strong LCP candidates rather than applied across the page. PageSpeed Insights identifies the LCP element for the page, making it easier to check whether the image that matters most is being discovered and loaded early enough.
If every image gets high priority, the hint stops being useful.
Sending data to the browser has a cost, even when the code is a single line:
<Dashboard data={hugeObject} />
Say hugeObject is a customer record with two years of orders attached, and the card on screen shows a single number: the total spent. Every one of those orders still has to be serialized and sent to the browser, increasing the data the browser must download and process before the interface is fully interactive.
The rule is simple: send only what the UI needs. Here that means adding up the total on the server and passing the card one number instead of the whole record.
In App Router, serialized props become part of the React Server Component payload sent with the page. When that payload grows to hundreds of kilobytes, it often means the browser is receiving far more data than the screen actually uses.
A typical list query in Supabase starts like this:
.select("*")
That retrieves every column, even when the UI needs only a few. Select only the fields the component uses:
.select("id, title")
The next question is how Postgres finds those rows. A list filtered or sorted by date, such as the latest posts, may require a sequential scan or explicit sort when no useful index supports the query:
CREATE INDEX idx_posts_created_at ON posts(created_at);
Row Level Security adds a less visible cost, since Postgres checks the policy against every row a query touches. Supabase’s RLS guide recommends indexing columns used in policy filters and wrapping auth.uid() in a select, so the function can be evaluated once per query instead of once per row.
EXPLAIN ANALYZE shows how PostgreSQL actually executes the query and how much time each step takes. An Index Scan shows that an index is being used, while a Seq Scan on a large, selective query can point to an indexing opportunity and the need for further database optimization.
Third-party scripts can block the main thread when they load too early:
<script src="analytics.js"></script>
The Next.js Script component lets you control when each script loads. With lazyOnload, the script loads during browser idle time:
<Script src="analytics.js" strategy="lazyOnload" />
There’s one catch with analytics: delaying the script too aggressively can mean some very short visits are never recorded. For tracking scripts that need to capture early page activity, afterInteractive is usually a safer choice than lazyOnload. A chat widget, by contrast, is a better candidate for lazyOnload, because it rarely needs to be ready immediately.
In the Performance panel, long tasks can often be traced back to the scripts that caused them, making heavy third-party code easier to spot.
Delay third-party scripts when you can, but not past the point where they stop doing the job you need.
Some pages hold everything back until the slowest piece of data arrives, so one sluggish query decides when the user sees anything at all. In the App Router, React’s Suspense can show the page shell and a fallback immediately while slower content streams in as it becomes ready:
<Suspense fallback={<Skeleton />}>
	<SlowComponent />
</Suspense>
On a dashboard with one slow chart, the difference may be as simple as showing a grey placeholder while the data loads. The numbers behind it still take three seconds to arrive, the same as before, and in the meantime, someone has already scrolled past the header and started changing the date range.
In the App Router, a loading.js file placed next to a page applies the same idea to the whole route without extra code. If one slow request is holding up the whole page, move that fetch into the component that needs it and wrap that component in a Suspense boundary.
We had a dashboard that worked, but quite slowly. The images got the blame first, so we optimized them, but performance barely changed.
So we started digging, and the first thing we found was a single `"use client"` at the top of the page, which pulled much more of the dashboard into the client bundle than necessary. There was more. The data was fetched only after render; the requests then went out one by one, and nothing was cached in between. Once we reduced the hydration cost, parallelized the requests, and added caching, the numbers moved a lot:
The fix lay outside the CDN and image settings. The app simply stopped doing work it didn’t need.
Slow apps rarely have one obvious culprit. More often, delays build up across the stack: too much work reaches the browser, requests wait on each other, data gets fetched again, or the page holds useful content back until everything is ready.
That is why performance work should start with finding where the waiting happens, not with optimizing whatever looks heaviest first. Once that bottleneck is clear, the fix is usually more focused: move work to the server, run independent requests together, cache repeated work, or send less data to the browser. The fewer unnecessary waits users encounter, the faster the app feels without changing what it actually does.
{{banner-2}}




.avif)