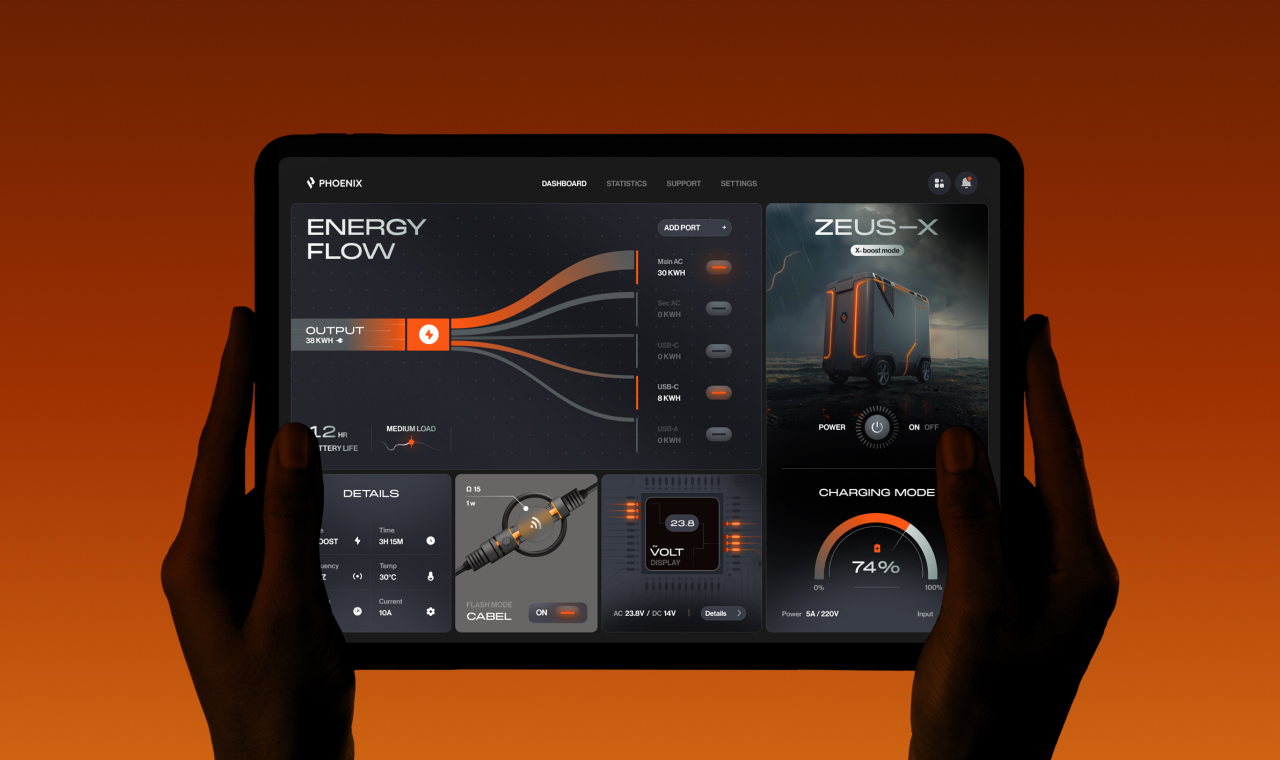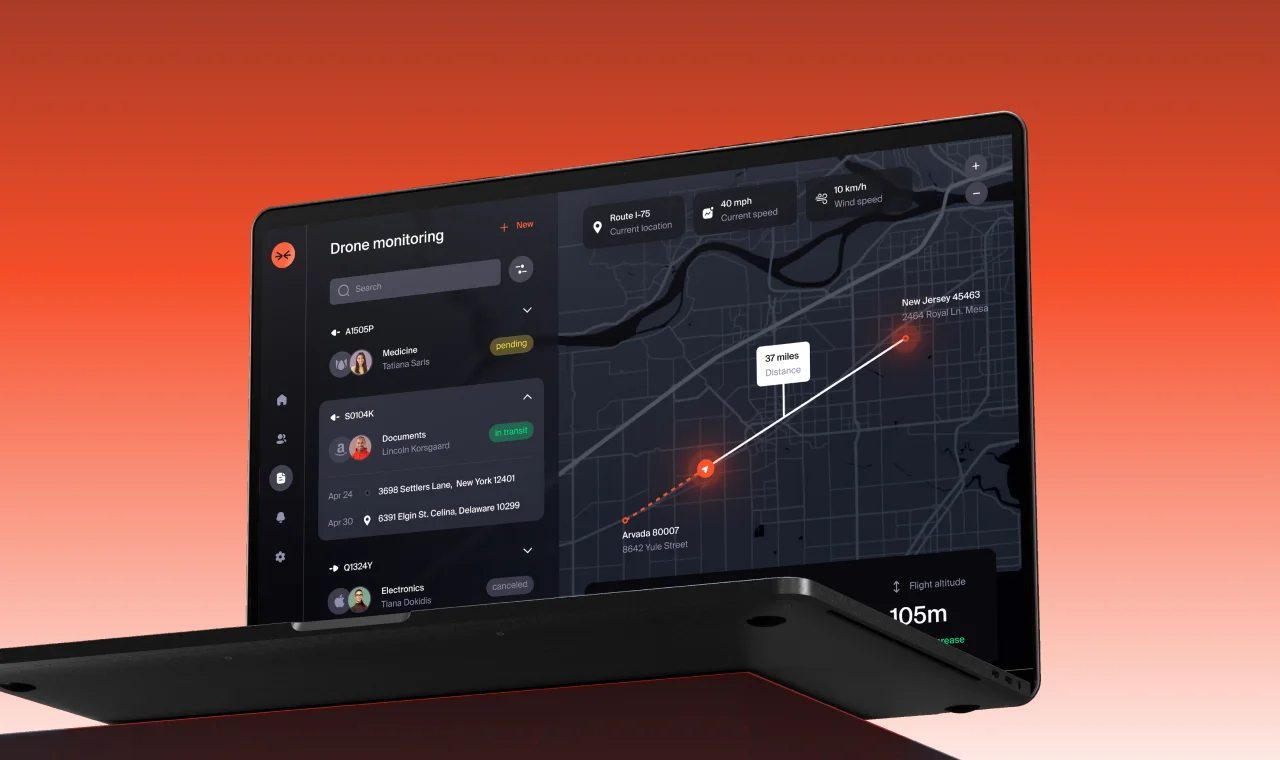





What a cleantech team gets from us first is clarity about who reads the number — an operator watching output in real time, a sustainability lead building a report, an auditor checking method. One dataset, three very different screens, and no room for a vague chart.
Halo Lab designs cleantech products against those readers — monitoring and telemetry dashboards, emissions and reporting tools, energy and asset management, and the customer-facing side. Method stays visible next to every figure, and the system is handed over annotated for your engineers.


Your company has grown, but the brand no longer reflects scale or direction.
Your company has grown, but the brand no longer reflects scale or direction.
Your company has grown, but the brand no longer reflects scale or direction.
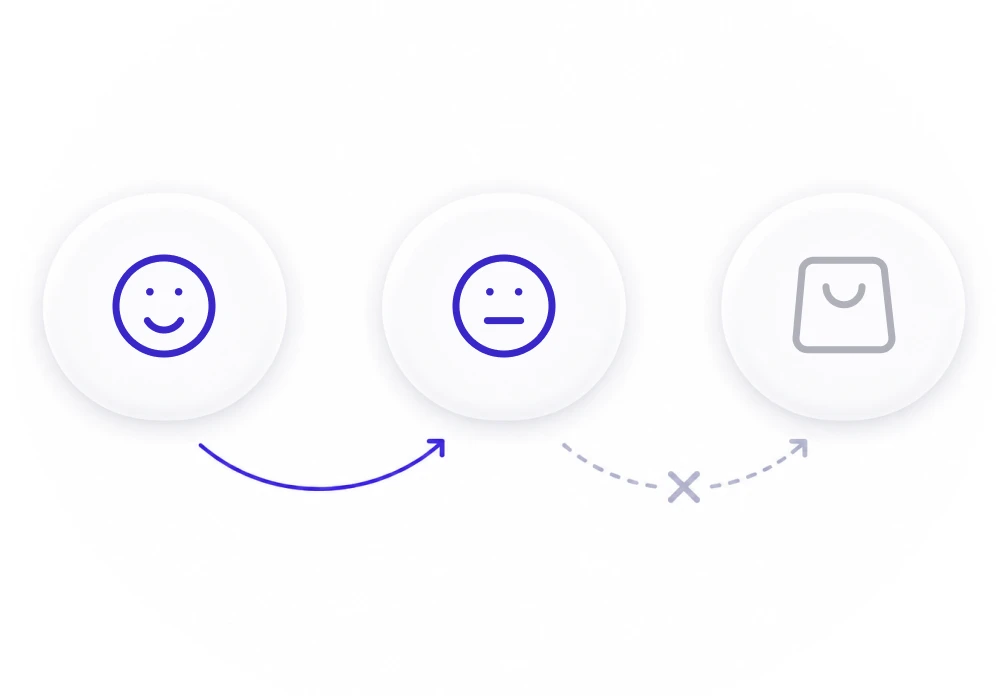
Live output data floods the screen and hides the single failing asset.

Emissions figures arrive without method, so auditors keep sending them back.
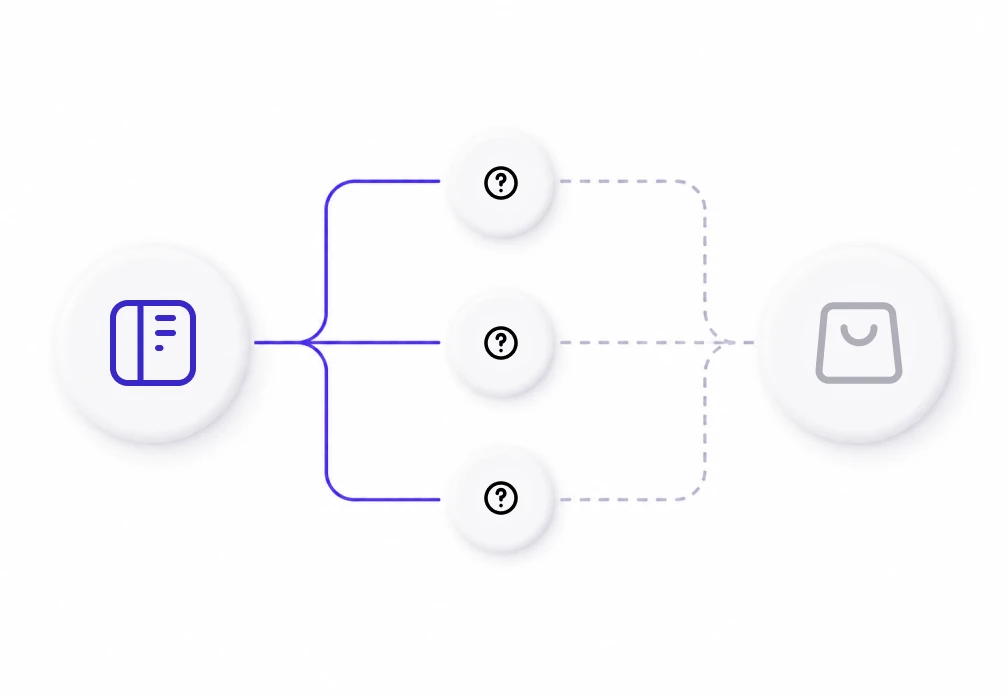
Customers see graphs but never learn what the change actually saved them.

“All projects in which we’ve involved Halo Lab have been great successes, but their leadership on our brand refresh is worth highlighting.”

“We’ve had feedback from users, investors, and employees, and everyone has said that Halo Lab did a fantastic job with the branding.”

“We’re proud of their branding services. They not only do what we tell them but also make suggestions to help us improve our offerings.”

What we deliver
Live output and status designed so the one failing asset surfaces immediately.
Carbon and ESG figures presented with method and source visible beside every number.
Generation, storage, and maintenance views designed for operators running distributed assets.
Usage, cost, and savings shown in money and units people actually recognise.
Demand, capacity, and balancing views designed for decisions made within minutes.
Commissioning, inspection, and maintenance apps designed for rooftops and weak signal.
Credit purchase, retirement, and verification steps designed with provenance intact.
A cleantech component library and annotated Figma handoff — ready for development to begin.


How we work

Start with a strategy call where we align on your goals, challenges, and priorities, and set a clear direction for the entire branding process.
3–4 Days
Research & analysis

We map who reads each number — operator, sustainability lead, auditor, customer — and what each one needs it to prove.
.webp)
We structure assets, sites, and metrics so a reading always carries its source and method.
.webp)
We wireframe the critical flows — monitoring, reporting, field, and customer — and validate them before visual design starts.
%20(2).webp)
We design every key screen and state, including live data views, building the component library alongside.

Annotated Figma files, interaction specs, and component documentation — your team builds without ambiguity.
Start with a strategy call where we align on your goals, challenges, and priorities, and set a clear direction for the entire branding process.
3–4 Days
Research & analysis
Industries we serve

UX/UI design for hospitals, clinics, and health systems.
UX/UI design for banks, insurance firms, and financial platforms.

UX/UI design for logistics, transport, and supply chain companies.

UX/UI design for property developers, agents, and management firms.

UX/UI design for schools, universities, and e-learning platforms.

UX/UI design for Web3 startups and blockchain-based products.

UX/UI design for wellness brands, gyms, and fitness studios.

UX/UI design for tech companies, software products, and platforms.

120+ experts and 500+ projects provide insights into solutions that fit the market.

Projects start with research, positioning, and clear goals for data-driven decisions.
No templates or generic patterns — only custom design shaped for your objectives.
We turn complex ideas into clear, scalable designs for SaaS, B2B, and tech companies.

Structured communication and transparent workflows keep you aligned at every step.

Clear pricing and adaptable scopes help you stay on budget and ensure top quality.
“Halo Lab is very organized in planning to achieve the goals within the set deadlines. We feel they were part of our internal team project.”

“Their experts have a very diverse range of skills and always find a solution to exposed issues. The communication process was clear.”

“During the collaboration, Halo Lab prioritized our people, always taking into account our input and ideas and giving all team members a voice.”

“The Halo Lab team unified branding across our patients’ app, showcasing professionalism, convenience, and consistency.”

“Halo recreated our existing portal with a modern and beautiful experience, greatly increasing usability and delight for the end user.”

“Halo Lab is brilliant. We were impressed with their timely delivery, cost-effectiveness, and the people who knew what they were doing!”

“The value we get from Halo Lab and their quality designs sets them apart from others. They are the right mix of price, talent, and style.”

“We gave the Halo Lab team a chance, and we immediately knew they were the ones we wanted to work with.”

“The Halo Lab work pleasantly surprised us, and bringing in their professional design team has been a worthy investment for us.”

“When collaborating with Halo Lab, we felt that communication was straightforward and that the deliverables fit what we expected.”

“Halo Lab has helped us with a rebrand and defined a new name, logo, and color palette. We’ve had a great experience working with them.”


12 years
We’ve built one of the most trusted agencies
150+
Specialists in design, engineering & product management
78%
Returning clients in Europe & North America
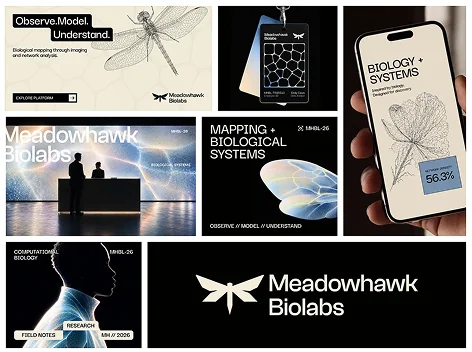

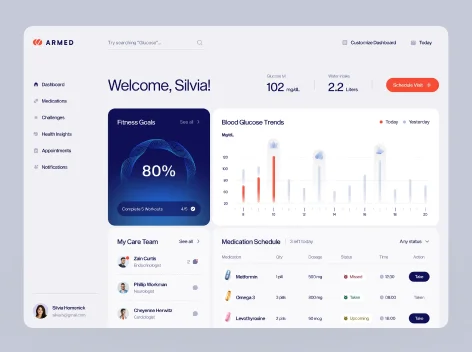
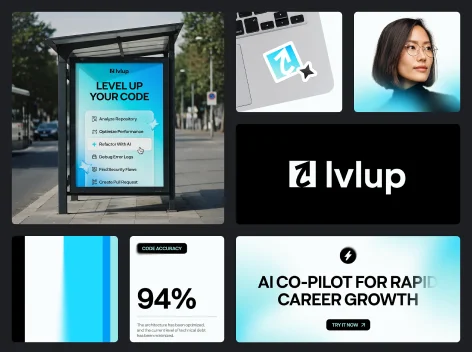
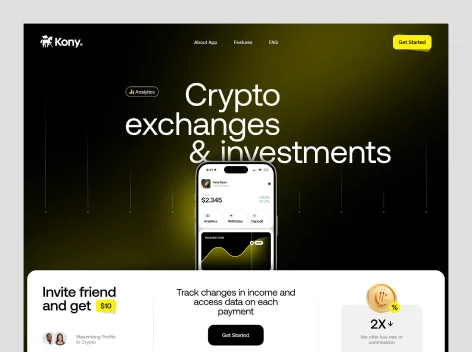
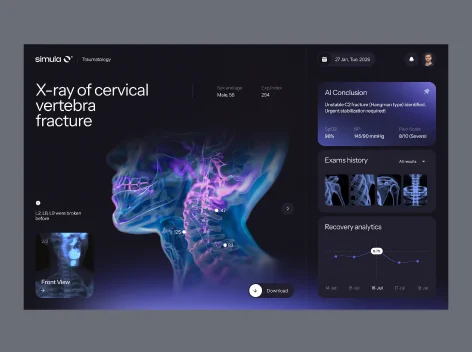

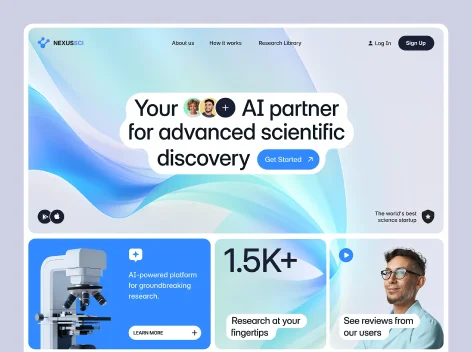
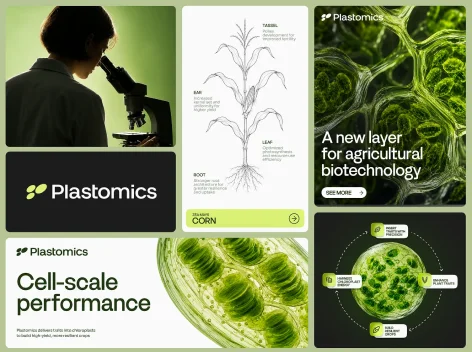
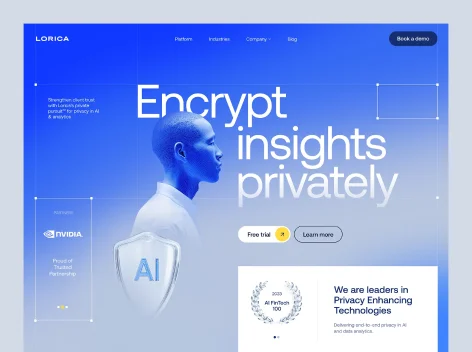

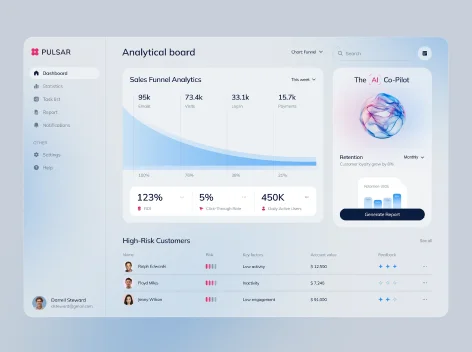
Role and data mapping, monitoring and telemetry dashboards, emissions and ESG reporting, energy and asset management, customer savings experiences, grid and load interfaces, field tools, offset flows, and an engineering handoff.
Yes. Real-time telemetry is designed around exceptions — the failing asset, the unexpected drop, the threshold crossed — rather than showing every reading with equal weight and hoping someone spots it.
Every figure is presented with its method, boundary, and source visible. That is what survives an audit, and it is usually the difference between a report being accepted and being sent back.
Yes. Usage, tariffs, and savings are shown in money and familiar units rather than raw kilowatt-hours, because that is the only framing most customers act on.
Yes. Commissioning, inspection, and maintenance apps are designed for rooftops, plant rooms, and weak signal — large targets, offline tolerance, and photo capture built into the flow.
Most engagements run 6 to 12 weeks from data mapping to engineering handoff, depending on how many asset types are in scope, reporting requirements, and whether a design system is included.
Yes. Demand, capacity, and balancing views are designed for decisions made within minutes, with the current state readable before any historical detail is opened.
Yes. Redesigns are common. We audit the current product against time to spot an anomaly, report rejection rate, and customer comprehension, then set measurable goals before visual work begins.
Yes. Web and mobile development is available after the design engagement, so the component architecture in Figma maps directly to the production build with no reinterpretation.